There are a lot of people predicting lower future returns for the US stock market (S&P 500). We’ve had high valuations and low interest rates for years now. An expensive stock market leading to lower future returns can make intuitive sense. But with all the predictions and noise, investors need a rate of return to know how much to save.
Most predictions I’ve seen are for the next 5 or 10 years. These are of little use since most people are investing for the long term. People should be less concerned about short term returns and more concerned about the next 25 years and beyond! I wanted to run the numbers to see what impact valuations have had on long term returns (25 yrs), using historical data on the S&P 500. What happened when I ran the numbers?
Here is the short answer: 4% real return (inflation adjusted return) is in line with historical returns and valuations.
For those people who need the long answer, keep reading. For those who really don’t care, well, stop reading. There might be some statistics below…
There are two different variables, to answer “what will future returns be”. The fist variable is valuations, think of this as how expensive the stock market is. The second variable is the subsequent returns, given current valuations. Think of this as how much money will made over 25 years. I used a few different variations of these two variables to see if there are better correlations.
Valuations
Earnings Yield (EY): this is a variation of the most commonly used valuation metric, the Price to Earnings (PE) ratio. If the S&P 500 earns $1 and trades at $10, its PE ratio is 10 ($10/$1). The Earnings Yield is inverse, 10% ($1/$10). I used EY instead of PE to make is easier to get the Return Spread, more on that later. I used Multpl to get this data.
Shiller CAPE Yield: the Shiller Cyclically Adjusted Price to Earnings ratio (CAPE) is similar to the PE ratio, but instead uses a 10-year average of inflation adjusted earnings. This is done to help smooth out the data, ignoring short term valuation spikes or drops. Similar to Earnings Yield, I used the yield on the CAPE ratio. If the CAPE ratio is 20, the CAPE Yield would be 5% (1/20). I used Multpl to get this data as well.
Returns
Nominal Return: this ignores the erosive affect inflation has on returns. If the S&P 500 earns 10% but inflation is 3%, the Nominal Return is 10% since it ignores inflation. I used return data from Slickcharts.
Real Return: this includes the erosive affect inflation has on returns. If the S&P 500 earns 10% but inflation is 3%, the Real Return is 7%. I used inflation data from US Inflation Calculator.
I ran a linear regression in an attempt to create an equation that will result in a predicted return, given a valuation metric. I used R² to compare which one had the strongest correlation. A higher R² means a stronger correlation between the variables and a tighter dot plot trend.
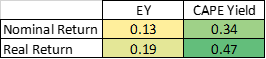
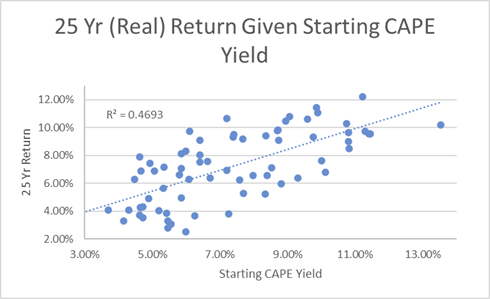
As you can see above, CAPE Yield is the best way to estimate the Real Return (return after inflation) for the next 25 years. The model with the best fit is the following:
Real Return = [0.7514 * CAPE Yield] + 0.0167
Reminder: CAPE Yield = 1/CAPE Ratio
As of 10/16/2020, the CAPE Ratio is 31.86. This makes the CAPE Yield is roughly 3.1% (1/31.86). Using the equation above, the model predicts a 4% real return over the next 25 years. This is an estimation based on historical data, there will never be a model that fits 100%. Anything can happen over the next 25 years. But it’s a decent place to start, and some kind of future return has to be assumed. It’s also a nice bonus that the model incorporates inflation, removing the need to predict what inflation will be.
So, what does all this fancy math actually mean? To put the 4% real return into context, to have today’s equivalent of $1,000,000 in 25 years, using 4% real return, roughly $2,000 would have to be saved and invested each month. The historical average real return has been 7%. This historical average would require only $1,300 saved and invested each month. The current high valuation levels have led to a decrease of 3% from the “norm”. But it’s a heck of a lot better than sitting in cash earning negative rea return, or bonds who barely earning anything.
